Mapping the political geography of US Presidential elections
As we all know, representations of reality shape perceptions of reality. A map of the US in which states are weighted by their electoral votes conveys a somewhat different picture of the overall shape of the American Presidential-election universe than a purely geographic or spatial map. Here are some examples (from 2008).
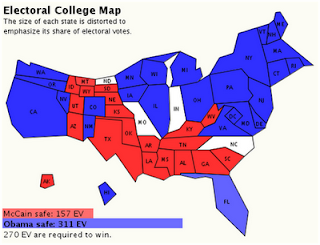
The first is a Cartogram of predicted 2008 election results based on data from FiveThirtyEight.com, presented by Jason Morrison's photostream. The explanatory code for this map is given here, along with some other electoral maps. Blue meant safe for Obama, red meant safe for McCain, and so on. The predictions were largely on-target, but I think what's most striking is the way this map conveyed the information.

(See that pure-red belt of states running from Texas up to the Canadian border, broadening out to take in Montana and Idaho at the top? On a purely spatial map of the US, of the sort one usually sees on the TV news, that portion of the country looks enormous. See here for an example, or the 2004 election map toward the end of this post. But in terms of comparative population figures, many of those states come close to being just big stretches of empty space. If it weren't for the fact that the Constitution gives each of them at least 3 electoral votes, some of those states would look even more minuscule on this map than they do now. California, Pennsylvania, New Jersey, New York, and New England, on the other hand ....)
Another map, also based on calculations from FiveThirtyEight.com, tried to do something similar while preserving each state's familiar shape. I suspect that for most of you this map will probably look less 'distorted' than the first one, even though it fragments the country. Or am I wrong about that?
-----
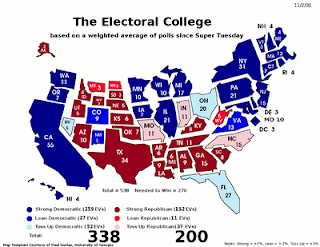
And here is yet another Electoral College Map from 2008, this one constructed by polling meta-analysts at the Princeton Election Consortium (further details here). I think this representation is even more striking than the one in the first map, and the projected outcomes turned out to be even more precise.
-----
=> And now, for the sake of contrast, here is a more standard-format election map for the 2004 US Presidential election (using the same post-2000 convention of red for Republican and blue for Democratic).
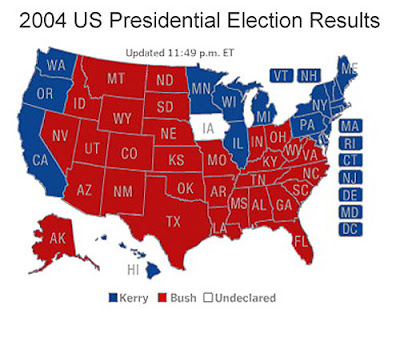
At first glance, that looks like a lot of red, doesn't it? Would you guess from this map that John Kerry came within a whisker of winning the election? (A switch of about 1% of the votes in Ohio—whose official results, incidentally, smelled a little fishy to some people—from red to blue would have given that state to Kerry and, with it, an Electoral College majority. You can check the figures here.)
=> There is actually a discipline called "political geography" with historical roots that go back to 19th-century France, Germany, and Britain; and I suppose these maps bring the tools of computer graphics to political geography. But that's just a new technological twist on an old story. Every kind of map has a perspective, and all cartographic projections are necessarily stylizing and selective. (And, in their own distinctive ways, weirdly distorting—consider the size of Greenland on a Mercator projection, for example.) That's true for physical maps, but even more for socio-political maps ... and, as it happens, most maps we see embody socio-political world-views.
For example, consider the intriguing but usually taken-for-granted fact that on almost all world maps not intended for specialized topographical or scientific purposes, the entire land surface of the earth is divided up into different countries, each with a precisely drawn border, on the premise that every patch of dirt must be part of one and only one of these political units. In the exceptional cases where some maps use dotted lines, that marks a political, conceptual, and symbolic anomaly. In this sense, the maps portray a Hobbesian or Westphalian world defined by mutually exclusive sovereignties. There's nothing natural, obvious, or inevitable about representing or conceiving the world that particular way. It means something.
—Jeff Weintraub
The first is a Cartogram of predicted 2008 election results based on data from FiveThirtyEight.com, presented by Jason Morrison's photostream. The explanatory code for this map is given here, along with some other electoral maps. Blue meant safe for Obama, red meant safe for McCain, and so on. The predictions were largely on-target, but I think what's most striking is the way this map conveyed the information.

(See that pure-red belt of states running from Texas up to the Canadian border, broadening out to take in Montana and Idaho at the top? On a purely spatial map of the US, of the sort one usually sees on the TV news, that portion of the country looks enormous. See here for an example, or the 2004 election map toward the end of this post. But in terms of comparative population figures, many of those states come close to being just big stretches of empty space. If it weren't for the fact that the Constitution gives each of them at least 3 electoral votes, some of those states would look even more minuscule on this map than they do now. California, Pennsylvania, New Jersey, New York, and New England, on the other hand ....)
Another map, also based on calculations from FiveThirtyEight.com, tried to do something similar while preserving each state's familiar shape. I suspect that for most of you this map will probably look less 'distorted' than the first one, even though it fragments the country. Or am I wrong about that?

-----
And here is yet another Electoral College Map from 2008, this one constructed by polling meta-analysts at the Princeton Election Consortium (further details here). I think this representation is even more striking than the one in the first map, and the projected outcomes turned out to be even more precise.

-----
=> And now, for the sake of contrast, here is a more standard-format election map for the 2004 US Presidential election (using the same post-2000 convention of red for Republican and blue for Democratic).

At first glance, that looks like a lot of red, doesn't it? Would you guess from this map that John Kerry came within a whisker of winning the election? (A switch of about 1% of the votes in Ohio—whose official results, incidentally, smelled a little fishy to some people—from red to blue would have given that state to Kerry and, with it, an Electoral College majority. You can check the figures here.)
=> There is actually a discipline called "political geography" with historical roots that go back to 19th-century France, Germany, and Britain; and I suppose these maps bring the tools of computer graphics to political geography. But that's just a new technological twist on an old story. Every kind of map has a perspective, and all cartographic projections are necessarily stylizing and selective. (And, in their own distinctive ways, weirdly distorting—consider the size of Greenland on a Mercator projection, for example.) That's true for physical maps, but even more for socio-political maps ... and, as it happens, most maps we see embody socio-political world-views.
For example, consider the intriguing but usually taken-for-granted fact that on almost all world maps not intended for specialized topographical or scientific purposes, the entire land surface of the earth is divided up into different countries, each with a precisely drawn border, on the premise that every patch of dirt must be part of one and only one of these political units. In the exceptional cases where some maps use dotted lines, that marks a political, conceptual, and symbolic anomaly. In this sense, the maps portray a Hobbesian or Westphalian world defined by mutually exclusive sovereignties. There's nothing natural, obvious, or inevitable about representing or conceiving the world that particular way. It means something.
—Jeff Weintraub
posted by Jeff Weintraub at 3:26 PM
![]()
![]()


<< Home